



 Compliance analytics
Find the outliers in your compliance data
Cresen brings your expense, payment, and transparency data into one compliance analytics warehouse, then builds the metrics that show where risk sits. Findings go straight into MonitorMate, where your team tracks them to closure.
What's included
- A compliance analytics data warehouse
- Standard metrics and custom KPIs
- Customized reports
- Policy violations and outliers flagged
- Restricted user access
- Findings tracked in MonitorMate
- PowerCMS category benchmarks from CMS data
From raw data to findings your team can act on
Collect
Travel and expense data, including Concur, financial payments, and transparency transfers of value
Refine
An ETL process cleans the raw data and loads it into a compliance analytics data warehouse
Measure
Standard metrics and custom KPIs flag outliers and gaps in the process or the data
Remediate
Findings move into MonitorMate and follow your remediation process
Metrics that point to your key risk indicators
Each metric looks for a pattern that often signals a problem. Together they become key risk indicators for sales representatives and HCPs, and one view of your overall risk.
Custom metrics give you a view built around your own policies, so your monitoring and reporting improve each year.
Example metrics
- Meals with repeat attendees
- Meals over the spending limit
- Speaker programs with too few HCPs
- Canceled programs with a fee for service paid
- Incentive compensation change from the prior period
- Medical information request change from the prior period
What you get
- Customized reports
- Key policy violations and outliers
- Restricted user access
- Issue identification and remediation
- Detailed data extracts
Track every finding to closure
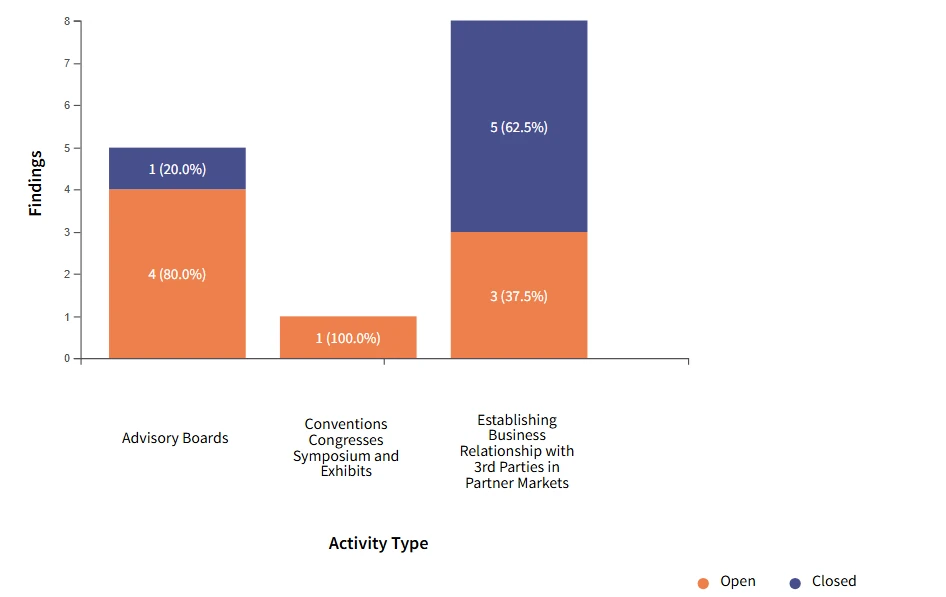
Every issue that compliance analytics finds is tracked in MonitorMate, with the same remediation workflow your team already uses for monitoring findings.
Talk to your data
Ask questions of a dataset in a chat and turn the answer into a report. Cresen uses ChatGPT and Microsoft Copilot to take you from analysis to report without building one by hand.
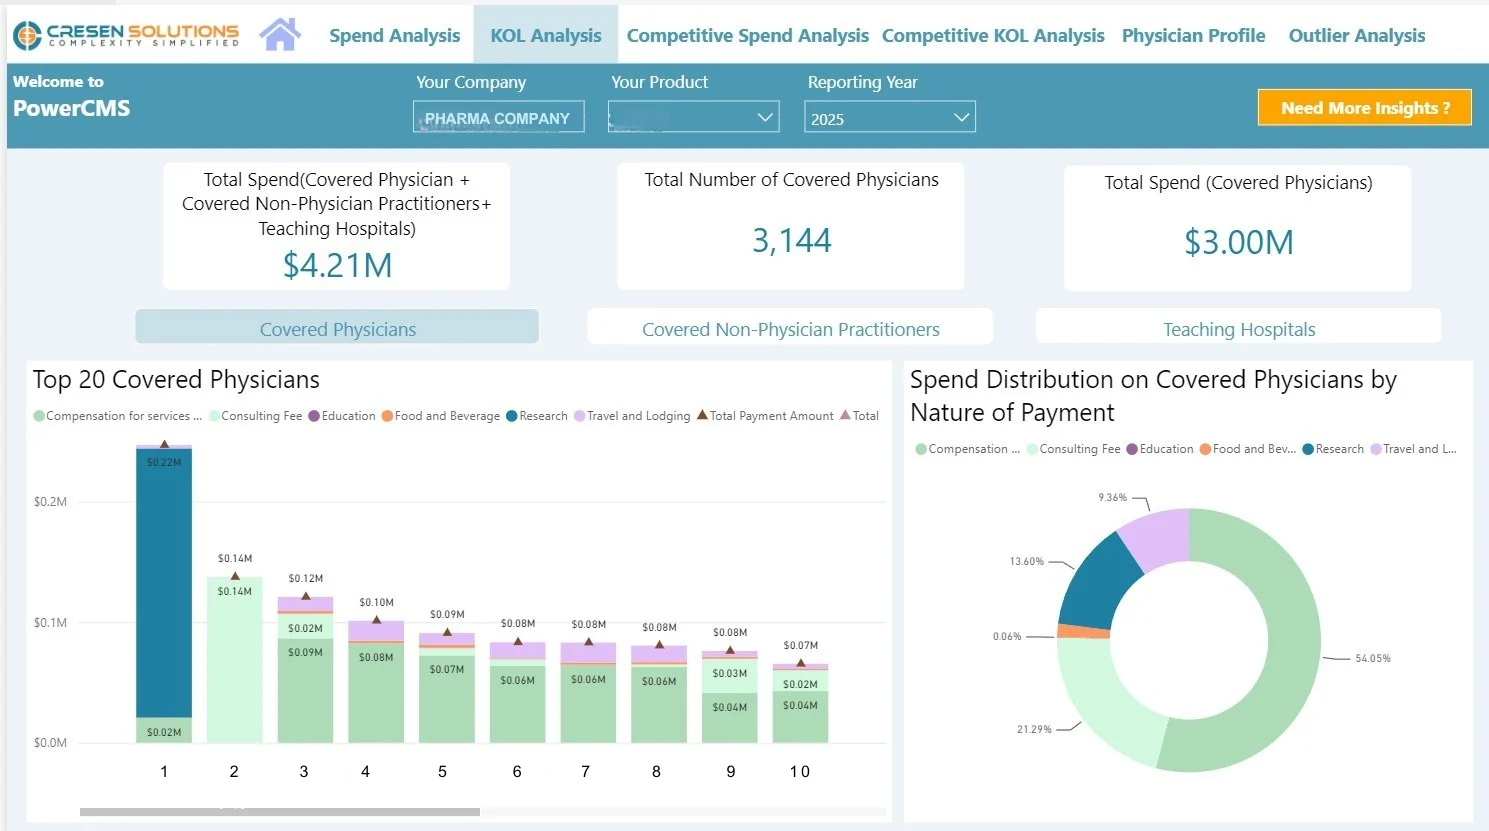
See how your HCP spend compares with your category
Compare competitor spend
Review what other companies in your product category spend on HCPs
Compare KOL payments
See payments to key opinion leaders, for future planning and risk assessment
Get PowerCMS
Request access to the analytics tool.

See which metrics would flag risk in your program
Tell us which data sources you have, and we'll show you the metrics and reports we would build from them.