Missed Opportunities in Compliance Analytics for Life Sciences
Most compliance analytics programs in life sciences are limited by design rather than by data. The information needed to spot risk early is usually already collected, but it sits in separate systems, gets used once, and never feeds back into what the next cycle looks at.
Key takeaways
- The constraint is rarely data volume. It is that monitoring, CAPA, audit, and transparency data live in separate tools and are never read together.
- Fixed spend thresholds structurally cannot catch drift. Variance against a representative’s own prior period can.
- Free text carries signal that spend data never will, and language analytics are rarely pointed at it.
- Transparency data has a second life beyond submission, including testing whether your own payments hold up on fair market value.
- Analytics only compounds when findings are tracked to closure and those outcomes change the next cycle’s thresholds.
Compliance teams in life sciences are not short of data. Monitoring logs, audit findings, CAPA records, transparency files, third-party due diligence, field activity. Volume is not usually the constraint. Most platforms get asked to answer what already happened, and stop there.
The pressure to get more from what you already collect keeps building, and when signals around healthcare professional (HCP) engagement or distributor risk go unnoticed, the cost turns up later as rushed remediation and repeat findings.
Value sitting in data you already hold
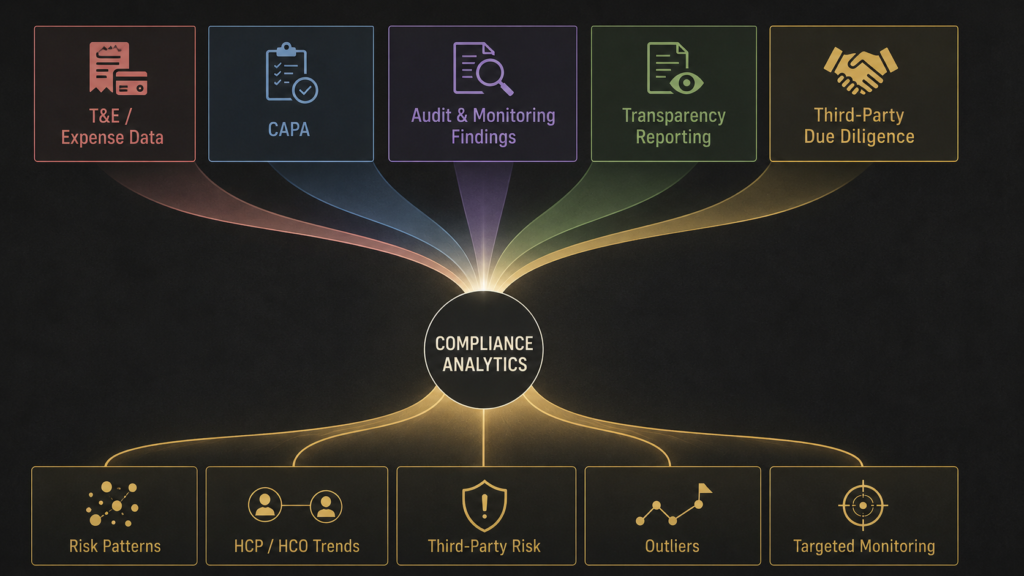
Most organizations already have what they need. It sits in pieces, owned by different teams, in systems that were never designed to talk to each other.
The most valuable of those sources is usually travel and expense (T&E) data, for a reason that gets overlooked: it records what actually happened rather than what was approved. Approval data describes intent. Expense data describes behavior, and the gap between the two is where most compliance risk lives.
Other underused sources tend to be:
- CAPA data from quality and safety systems that never reaches commercial or medical monitoring
- Audit and monitoring findings that end their life inside slide decks and static PDFs
- Transparency reports treated as an annual submission rather than a running record of behavior
- Third-party due diligence outcomes that never feed everyday risk scores
Because monitoring, CAPA, audits, and transparency usually live in separate tools, patterns that cut across them go unnoticed. A distributor picks up a minor finding in due diligence. Product complaints tick up somewhere else. Field behavior shifts in a third system. Each signal on its own looks manageable. Read together they describe something different.
The practical work here is unglamorous. Data from expense systems, financial payments, and transfers of value has to be extracted, cleaned, and landed somewhere it can be queried together, and the detail work is where most attempts stall. Concur extracts, for instance, arrive as UTF-16 rather than UTF-8, so anything reading them has to declare the encoding or the load fails in ways that look like data problems rather than format problems. That warehouse layer is what most programs skip, and skipping it is why the analysis never gets past single-source reporting.
Where monitoring rules leave signals on the table
A second gap sits in how monitoring rules get built. Many platforms run on fixed thresholds and never move past them.
Common patterns:
- Fixed spend limits per HCP or healthcare organization (HCO) that ignore context
- Flat frequency rules for visits and events that miss how behavior changes over time
- Risk models that go unrevised when regulations shift or enforcement patterns change
The alternative is variance against a representative’s own prior period, and it is the thing a fixed threshold structurally cannot do. Someone who is always slightly above average never trips a limit. A threshold has no memory of what that person looked like last quarter, so a steady upward drift stays invisible until it crosses a line that was never calibrated to them in the first place.
The metrics that actually surface risk tend to be more specific than a threshold, and more boring:
- Meals with repeat attendees
- Meals exceeding local limits
- Speaker programs with fewer HCPs than expected
- Cancelled programs where fee-for-service was still paid
- Incentive compensation variance against the prior period
- Medical information request form (MIRFS) variance against the prior period
None of these is alarming on its own. A cancelled program with a paid speaker fee happens for legitimate reasons. But consolidated into key risk indicators at the level of individual sales representatives and HCPs, they produce a view of aggregate exposure that no threshold rule generates. This is the difference between a platform that flags policy breaches and one that identifies who is drifting.
Free text is another blind spot. Call notes, medical information requests, and audit narratives carry real signal, and language analytics rarely get pointed at them. A call note recording that a physician asked about an unapproved use, and that the representative answered, is a compliance event that no spend threshold will ever surface. It sits in a sentence somebody typed and nobody re-read.
Day-to-day operations weaken monitoring too. Data arriving late from CRM or ERP turns alerts into history. And when findings from field compliance and investigations never flow back into the platform, alert logic stays frozen even after the same issue appears three times.
Closing the loop between CAPA, audits, and future risk
CAPA and audits exist to change what happens next. In practice they get managed as checklists rather than as inputs to analytics.
Two patterns show up repeatedly:
- CAPA tasks logged as free text, with no structured fields for root cause, impact, or related third parties
- Audit findings summarized at a high level and filed, with no link back to monitoring rules or risk scores
The result is that repeat root causes across products, regions, or third parties stay invisible. Issues that should shape next year’s plan end up as anecdotes.
Treating CAPA and audit results as inputs rather than endpoints changes that. Audit ratings and CAPA outcomes can adjust risk scores for specific third parties, HCPs, or countries, drive targeted sampling in upcoming monitoring cycles, and show which topics and roles need focused training.
The mechanism matters as much as the intent. Findings from analytics need somewhere to go, tracked through remediation to closure rather than logged and left. In our own stack, findings surfaced by analytics flow into MonitorMate and get managed through a remediation process configured to the organization, which is what stops the loop from breaking at the point it usually breaks.
Transparency data has a second job
Transparency reporting produces one of the largest structured datasets a life sciences organization owns. Payments, transfers of value, consulting arrangements, travel. Most of it gets used once, for submission.
What gets missed:
- Separate processes for US, EU, and other regions with no standard view across them
- Using the platform for file generation but not for comparison across markets
- No tracking of how engagement with key HCPs and HCOs changes year over year
There is a further step most teams never take. US transparency data is published by the Centers for Medicare and Medicaid Services (CMS), which means the whole category is visible, not just your own filing. Read against that backdrop, your own payments stop being a submission and become testable: whether an engagement holds up on fair market value, and where your spend sits as an outlier against the category. PowerCMS, our compliance data analysis tool, runs that comparative analysis against the published CMS data.
Disclosure obligations continue to widen. EFPIA disclosure requirements in Europe and the national transparency regimes that have come in outside the US mean the same activity is increasingly reportable in more than one place, on more than one schedule. A forward-looking read of this data lets teams find high-risk clusters before a reporting requirement makes finding them mandatory. We covered the underlying rules in our guide to healthcare transparency reporting requirements.
What a learning system looks like
All of this points one direction. Analytics should improve with each cycle rather than reset.
| Descriptive dashboard | System that learns | |
| What it answers | What happened last quarter | Where risk is building now |
| Where an alert goes | Into a report | Into case intake, investigation, and resolution |
| Thresholds | Fixed until someone revises them | Adjusted by what previous outcomes showed |
| Issue tracking | Ends at the finding | Tracked from first signal to closed CAPA |
| Effect over time | Same output every cycle | Each cycle changes what the next one looks at |
AI is doing real work here now, provided it is governed. Variance analysis against an individual’s own prior period catches drift that a population-level threshold never will. EZPredict, our predictive scoring engine, scores a new third party on submitted documentation alongside external regulatory and legal intelligence, which changes the onboarding decision rather than documenting it afterward. That sits separately from RAMP, the in-product risk assessment and mitigation workflow, and the two do different jobs. Audit planning built from prior findings, open quality issues, and contract terms produces an agenda pointed at where risk actually sits.
Conversational access matters more than it sounds. Being able to ask a question of a dataset and get an answer, rather than requesting a report and waiting two days, is what determines whether analytics gets used by the people who need it or only by the team that owns the tool.
Governance matters more in this industry than in most. Models need documentation and logic a reviewer can explain, plus a scheduled review. Access needs restricting by role, because compliance analytics contains exactly the data that shouldn’t circulate freely. And local markets need a voice in the design, or global rules end up describing conditions that don’t exist on the ground.
This is as much about people as tooling. Compliance and commercial oversight teams need enough confidence to question what the platform tells them. IT needs to understand what compliance is actually trying to catch. And leadership needs to see analytics as something that manages risk rather than as a reporting cost.
Frequently asked questions
What is the difference between compliance monitoring and compliance analytics?
Monitoring tests activity against rules and produces findings. Analytics reads across the data those findings sit in, looking for patterns that no single rule would catch. Monitoring tells you a transaction breached a limit. Analytics tells you which representative has been drifting toward that limit for three quarters.
Which data source gives the fastest return?
Usually T&E, because it records actual behavior rather than approved intent, and because most organizations already hold years of it. The second is CAPA data read by third party rather than by product, which turns a quality record into a supplier risk profile.
Do we need to connect everything before this is useful?
No, and attempting to is how these programs stall. Two or three sources landed properly in one place will surface more than six sources half-connected.
How do we know our metrics are the right ones?
Test them against what your last two years of findings and investigations actually turned up. If your current indicators would not have caught the issues you already know about, they will not catch the next ones either.
Find out what your indicators are missing
Send us the list of indicators you run today and we will tell you which risks they do not cover. It is a short exercise, you get the gap list either way, and it tends to be more useful than a demo.
Contact us to arrange it, or request access to PowerCMS if you want to run the CMS comparison yourself first.